How to plot a 3D Earth map using Basemap and Matplotlib
September 3, 2017
In this tutorial, I will show you how to plot a 3-Dimension Earth Map from satellite data using Basemap and Matplotlib.
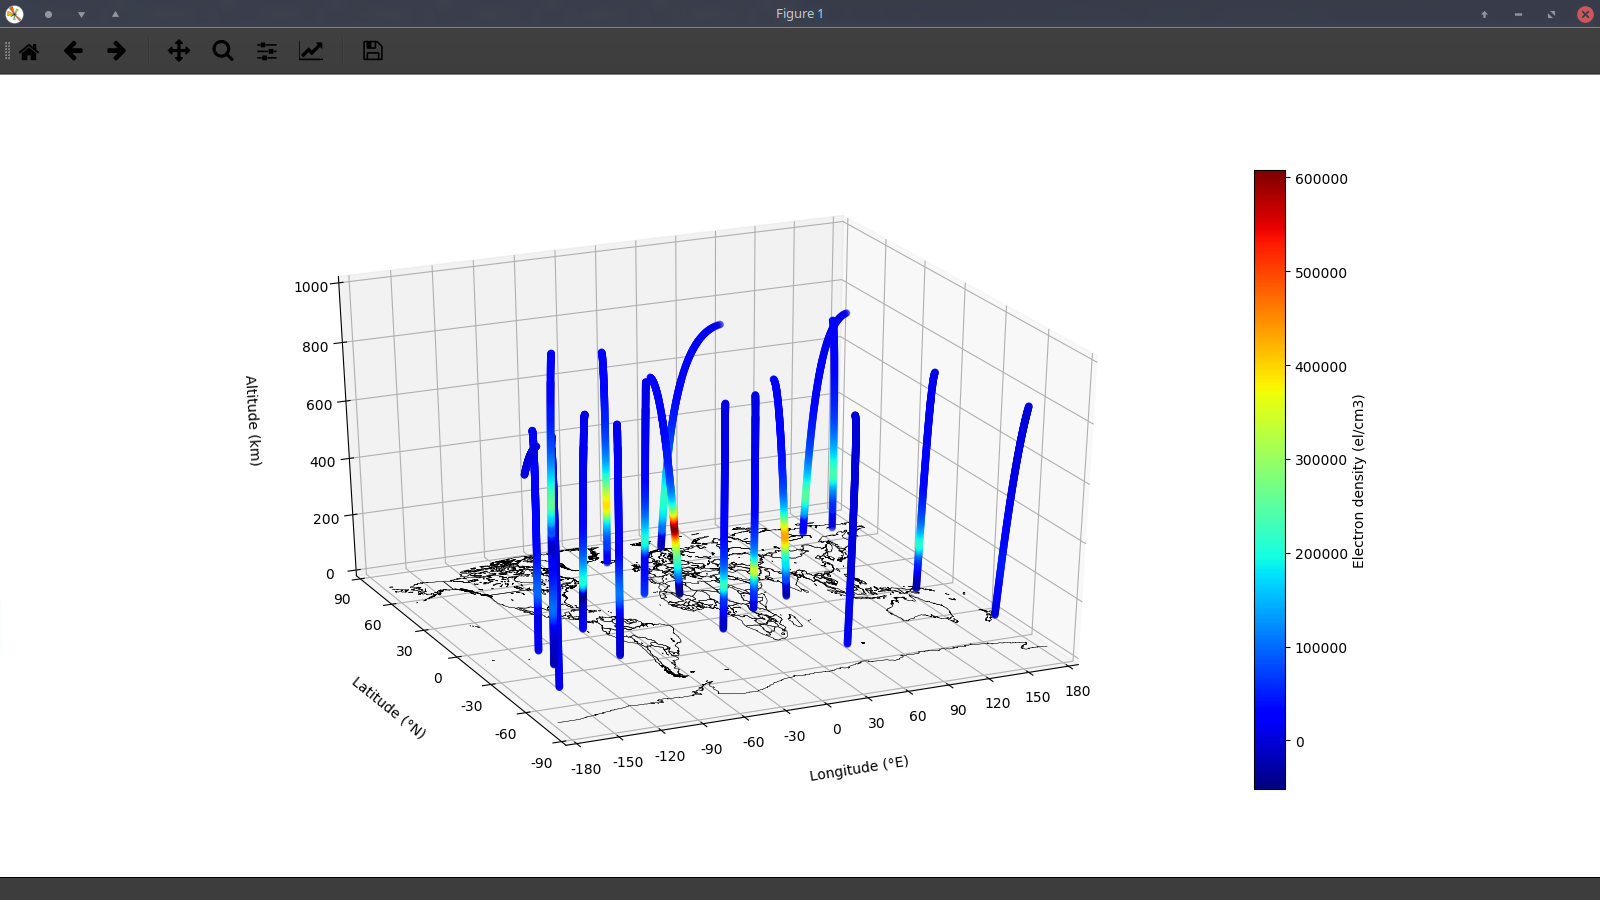
The result will be something like this with interaction:

All the sample data and code file can be found here: https://github.com/lkhphuc/Matplotlib-3D-Basemap
The data
We will try to plot the data from a real satellite COSMIC . We will plot a scientific information - Electron density or TEC (Total Electron Content) with respect to longtitude, latitude, altitude in 3D map.
Libraries:
- The data is in nc format and will be read using the netCDF4 library.
- To illustrate the position with the lon, lat info, we will use Basemap.
- To plot a 3D figure we use the mplot3d package of matplotlib.
Import
import os
import matplotlib as mpl
import matplotlib.pyplot as plt
import numpy as np
from mpl_toolkits.basemap import Basemap
from mpl_toolkits.mplot3d import Axes3D
from netCDF4 import Dataset
Create a 3d normal figure
fig = plt.figure()
ax = fig.gca(projection='3d')
Draw the Earth map using Basemap
# Define lower left, uperright lontitude and lattitude respectively
extent = [-180, 180, -90, 90]
# Create a basemap instance that draws the Earth layer
bm = Basemap(llcrnrlon=extent[0], llcrnrlat=extent[2],
             urcrnrlon=extent[1], urcrnrlat=extent[3],
             projection='cyl', resolution='l', fix_aspect=False, ax=ax)
# Add Basemap to the figure
ax.add_collection3d(bm.drawcoastlines(linewidth=0.25))
ax.add_collection3d(bm.drawcountries(linewidth=0.35))
ax.view_init(azim=230, elev=50)
ax.set_xlabel('Longitude (°E)', labelpad=20)
ax.set_ylabel('Latitude (°N)', labelpad=20)
ax.set_zlabel('Altitude (km)', labelpad=20)
# Add meridian and parallel gridlines
lon_step = 30
lat_step = 30
meridians = np.arange(extent[0], extent[1] + lon_step, lon_step)
parallels = np.arange(extent[2], extent[3] + lat_step, lat_step)
ax.set_yticks(parallels)
ax.set_yticklabels(parallels)
ax.set_xticks(meridians)
ax.set_xticklabels(meridians)
ax.set_zlim(0., 1000.)
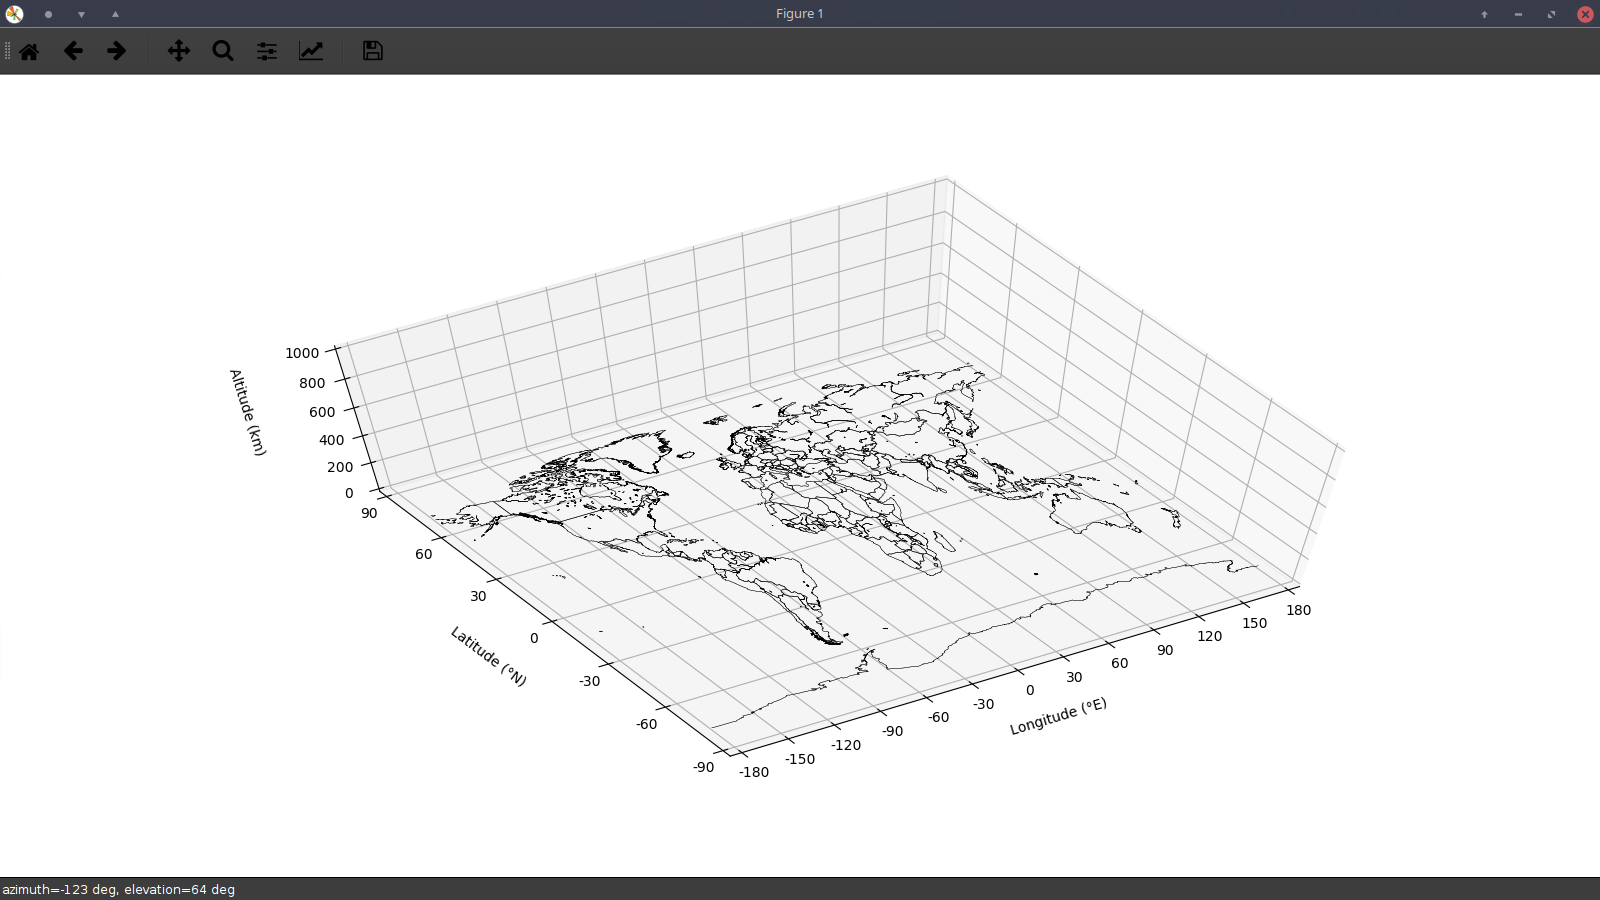
At this point you can add plt.show() and see a nice Basemap in an interactive 3D projection.
